Via Plugins
Visualize and analyze MATSim simulations
Via can be extended with several plugins. The plugins are included in the default download of Via, but require a corresponding license to be activated and to provide the functionality to users.
Currently, the following plugins are available:
Public Transport
Visualize transit lines and routes, analyze vehicle occupancy, passenger flows at stops, and more.
The Public Transport plugin supports MATSim’s transitSchedule.xml and transitVehicles.xml files to visualize and
analyze various aspects of MATSim’s transit simulation.
Main features:
- Visualize transit stop facilities
- Visualize transit vehicles halting at stops
- Visualize transit vehicles different from private vehicles
- Visualize transit routes
- Calculate and visualize occupancy per transit vehicle
- Analyze the number of passengers boarding/alighting at a stop
- Analyze the occupancy of transit vehicles along a route, either per departure or aggregated over a time window
- View a graphical schedule, comparing the actually simulated schedule vs planned schedule
Car Counts
Compare your simulation results to real world data from counting stations in a variety of customizable statistics.
The Car Counts plugin supports MATSim’s carCounts.xml files to interactively compare MATSim simulation
results to traffic counts.
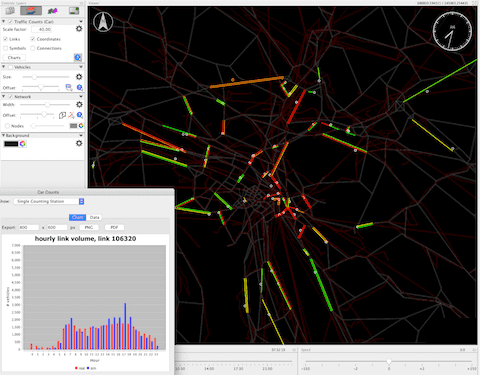
Main features:
- Visualize location of counting stations
- Visualize links mapped to counting stations
- Visualize hourly differences between simulation and counted values
- Analyze hourly volumes for links
- Build aggregations over all or a selected set of counting stations

Aggregation Analysis
Analyze arbitrarily filtered data in an aggregated manner to quickly and easily show the essential meaning of your data.
Aggregate point datasets into different grids (rectangular, hexagonal, triangular) or into arbitrary zones defined by shapes.
Filter the data using the points’ attributes, and use different aggregation functions to find minimum, maximum or average values, counts or sums.
Aggregate trips (pairs of origin and destination), and filter by trip attributes.


Movie Recorder

Record your animated visualizations directly into a movie file for easy sharing, or convert your previously recorded screenshots into a high-quality movie file.
The movie recorder plugin allows you to directly record Via animations into movie files, or to convert recorded screenshot sequences into movie files.
Movies can be created with a different encodings and quality settings. The currently supported movie formats are:
- MOV (Apple Quicktime)
- AVI
- H.264 / MP4
- Apple ProRes
- Animated GIF
The movies should be viewable on most of the today’s current computer system, e.g. with Windows Media Player on Windows, QuickTime Player on Mac OS X, or VLC on any operating system supporting VLC.
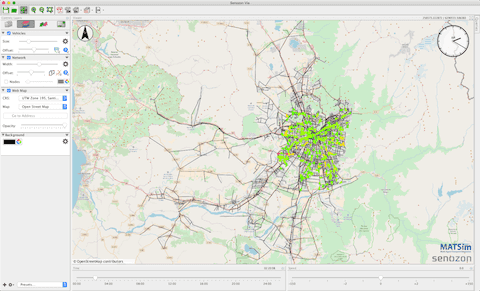
Map Backgrounds
Use maps from OpenStreetMap, Bing or other web services as backgrounds, or load your own raster images as a background.
The Map Background plugin provides different ways to include maps as background images:
- Web Map Tile Service (WMTS): This is how most maps displayed on internet pages work. Via can directly use maps from OpenStreetMap (several rendering styles), Google Maps, Bing Maps (roads or satellite imagery) and other map providers. Custom map providers can be added simply by providing the corresponding URL.
- Web Map Service (WMS): Many GIS institutions provide renderings of their geodata using the web map service (WMS) standard. Via can connect to such data providers and show maps provided from WMS as background.
- Raster Images, GeoTIFF: Raster images are pixel image files with an additional geographical extent. Often, cadaster maps or extracts from official maps are available in this format. Via can load such images and place them automatically at the right position.
Scripting

Automate the loading of data, the analysis of scenarios or the recording of movies using an integrated scripting API.
Use the built-in script-editor to automate repetitive tasks, load data and create layers, run analyses and export the results, or automate and fine-tune movie recordings (requires the Movie Recorder plugin).Emissions
Analyze the emission events from MATSim's emission extension.
Analyze the emissions calculated by MATSim’s emission extension. Visualize selected emissions on links of the network dynamically over the time of day, or show the emissions of a link in a chart over the time of day.
